The stock market hoped for curtailment of tariffs on Wednesday, but that didn’t happen. Even the better-than-expected March non-farm payrolls weren’t enough to turn things around.
The stock market slid sharply with the S&P 500 ($SPX), Nasdaq Composite, and Dow breaking through key technical support levels and closing very close to the low of the day’s range.
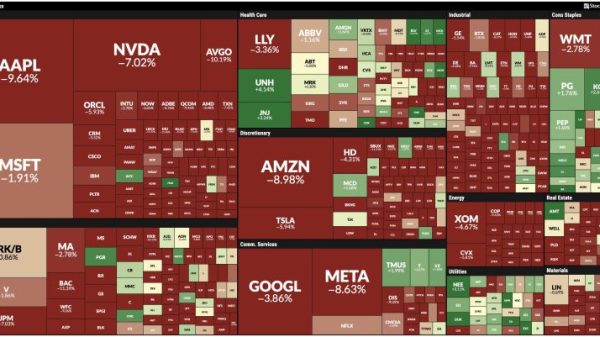
The StockCharts MarketCarpets was a sea of deep red with a few small green islands. All S&P sectors were trading lower on Friday.
The selloff was across the board and precious metals, which soared in the early part of the week, got slammed after the tariff announcement. When investors sell off equities and precious metals, it’s a sign of elevated fear, which is reflected in the spike in the Cboe Volatility Index ($VIX). It closed at 45.12, close to its high of 45.56.
Not a Pretty Picture
The adage, “The stock market takes the stairs up and the elevator down,” rings true. Unfortunately, things got ugly quickly. It’s a volatile environment, and if your portfolio includes mostly equities, you’re probably beside yourself. But it’s not time to let your emotions get the better of you. Neither is it the time to engage in dip buying. If you look at any chart of the market, it’s clear which direction the market is heading.
The three-year weekly chart of the S&P 500 ($SPX) below shows the index has dropped below its August lows.
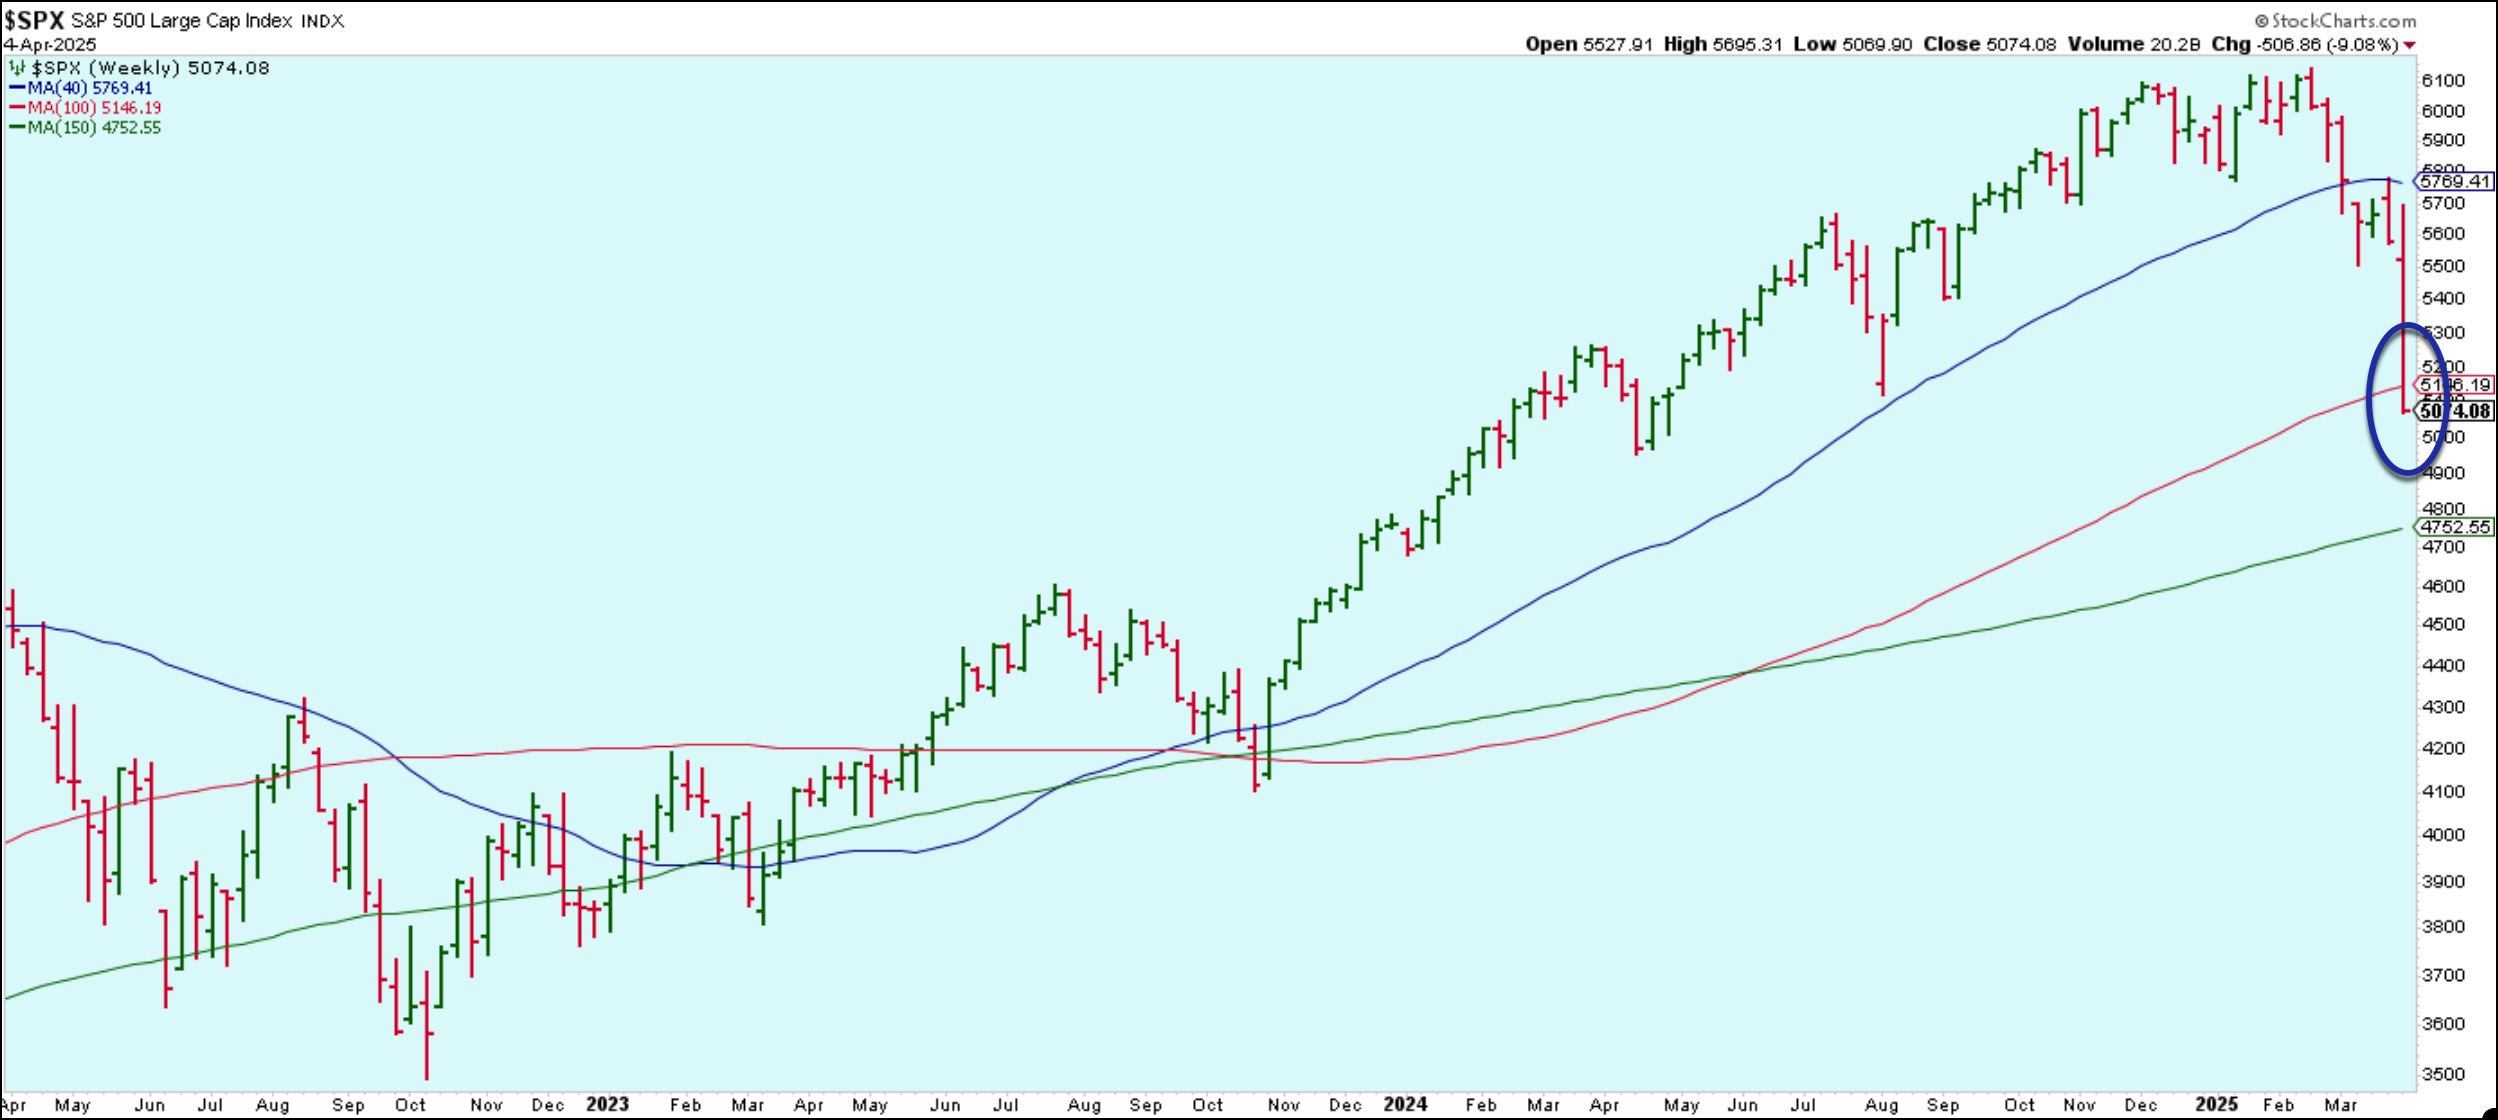
FIGURE 1. THREE-YEAR WEEKLY CHART OF THE S&P 500 INDEX. It was a rough week in the stock market with the S&P 500 closing below its 100-week simple moving average. Chart source: StockCharts.com. For educational purposes.
In March, the S&P 500 crossed below its 40-week simple moving average (SMA), the equivalent of the 200-day SMA. Wednesday’s tariff announcements sent the index even lower, breaching its 100-week SMA, approximately a two-year average. Another concerning point is that Friday’s close is below the August 2024 low. This increases the probability of the index dropping further, perhaps as low as its 150-week SMA. But then again, you never know what the market is going to do.
A smart investor is always engaged with the market in good times and bad. It’s important to observe the price action at key support levels to get an insight into when buyers come back into the market.
Looking at Market Breadth
The Bullish Percent Index (BPI), a breadth indicator that gives a bird’s eye view of the internals of different indexes and sector ETFs, isn’t encouraging, at the moment. The only sectors or indexes at or above 50, as of this writing, are the S&P Consumer Staples Sector BPI ($BPSTAP) and the S&P Utilities Sector BPI ($BPUTIL). Despite the slightly bullish values, the corresponding ETFs are trading below their 50-day SMA.
The chart below displays $BPUTIL with the chart of the Utilities Select Sector SPDR Fund (XLU). Even though the BPI of the Utilities sector is above 50, it’s still trending lower and XLU just crossed below its 50-day SMA.
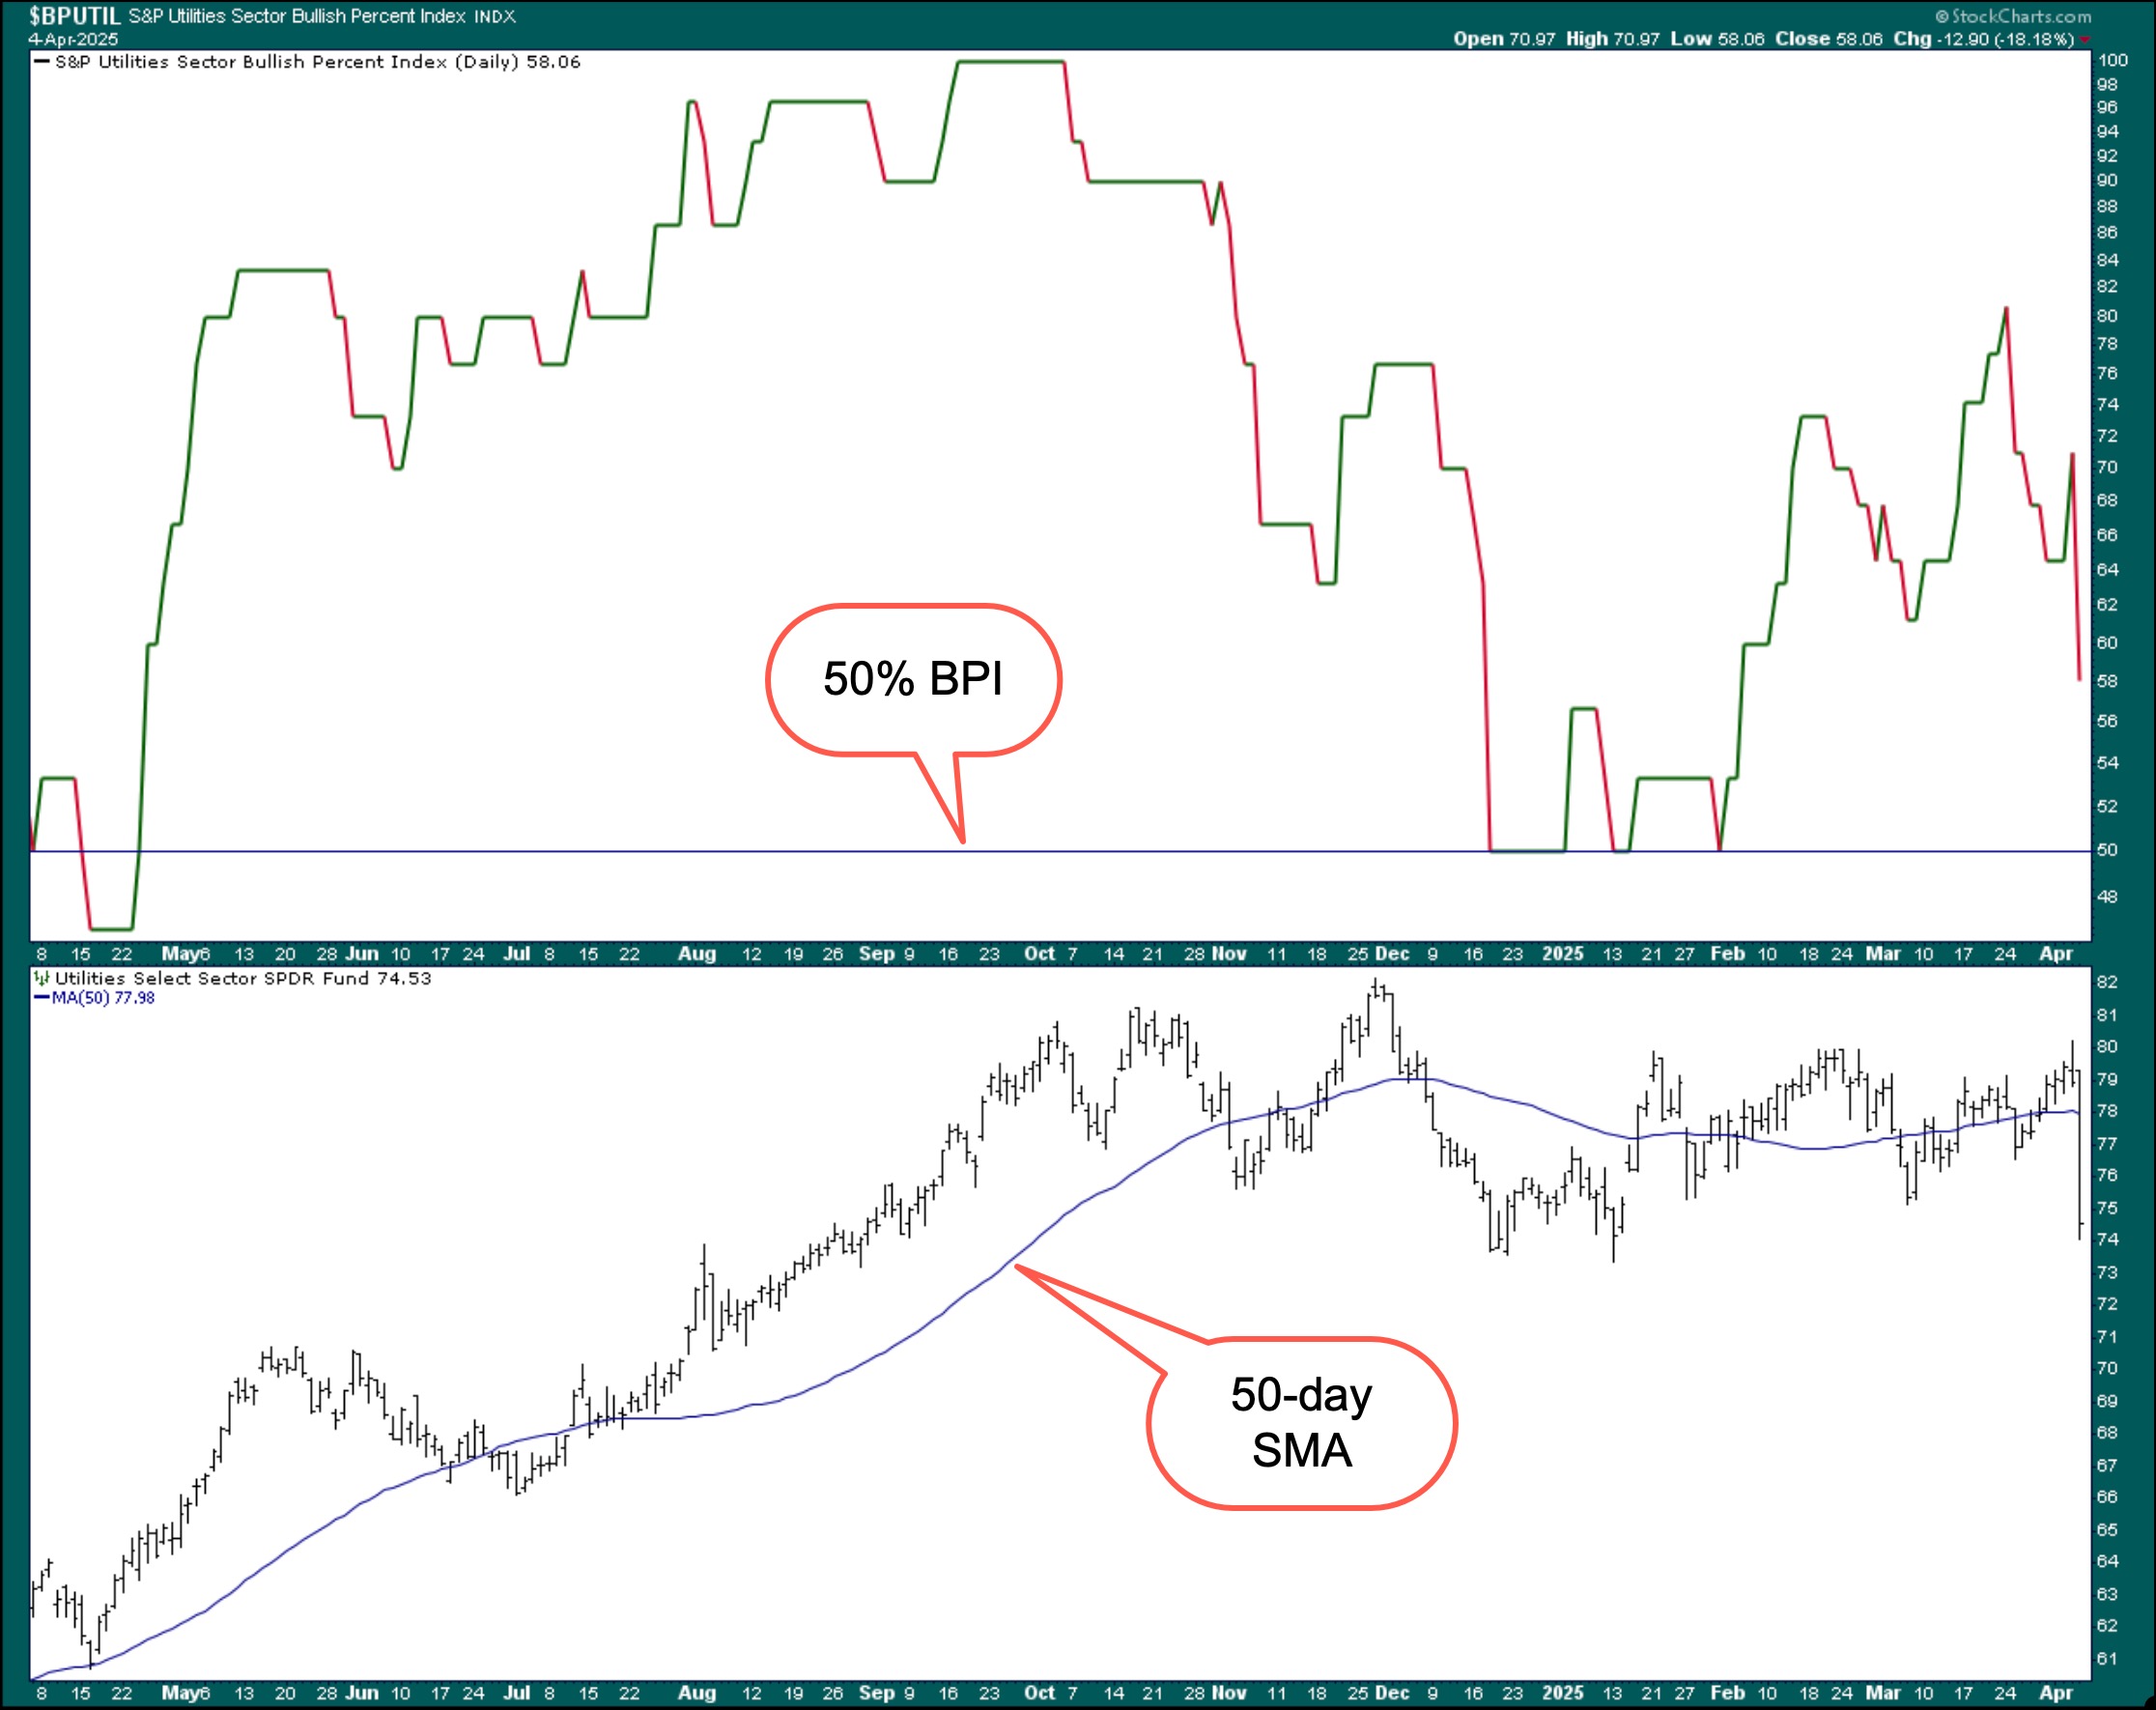
FIGURE 2. THE UTILITIES SECTOR IS ONE SECTOR WITH A BPI OVER 50. While a BPI over 50 indicates bulls are in favor, the chart of XLU has fallen below its 50-day SMA. Generally, breadth is leaning towards bearishness. Chart source: StockCharts.com. For educational purposes.
Sellers are in control across the board. The key will be to identify when buyers are in favor. And for that, you need to monitor the BPI and other breadth indicators.
Investor sentiment got overly bearish quickly. When this occurs, investors usually look for signs of capitulation. We’re not seeing those signs yet, but it’s worth adding sentiment indicators to your toolkit.
Sentiment Check
At some point, the selling will stop and buyers will come back in. The worst action to take now is to enter positions when you think the market has hit its low, only to catch a falling knife.
When markets are at extreme levels of fear or greed, sentiment indicators such as the VIX can be helpful. Besides the VIX, the American Association of Individual Investors (AAII) Sentiment Survey helps identify when investors are extremely optimistic or pessimistic. Generally, when emotions reach extreme levels, it may be an alert to move in the opposite direction of the crowds.
The five-year weekly chart below displays the S&P 500 with the AAII bullish minus bearish sentiment in the lower panel.
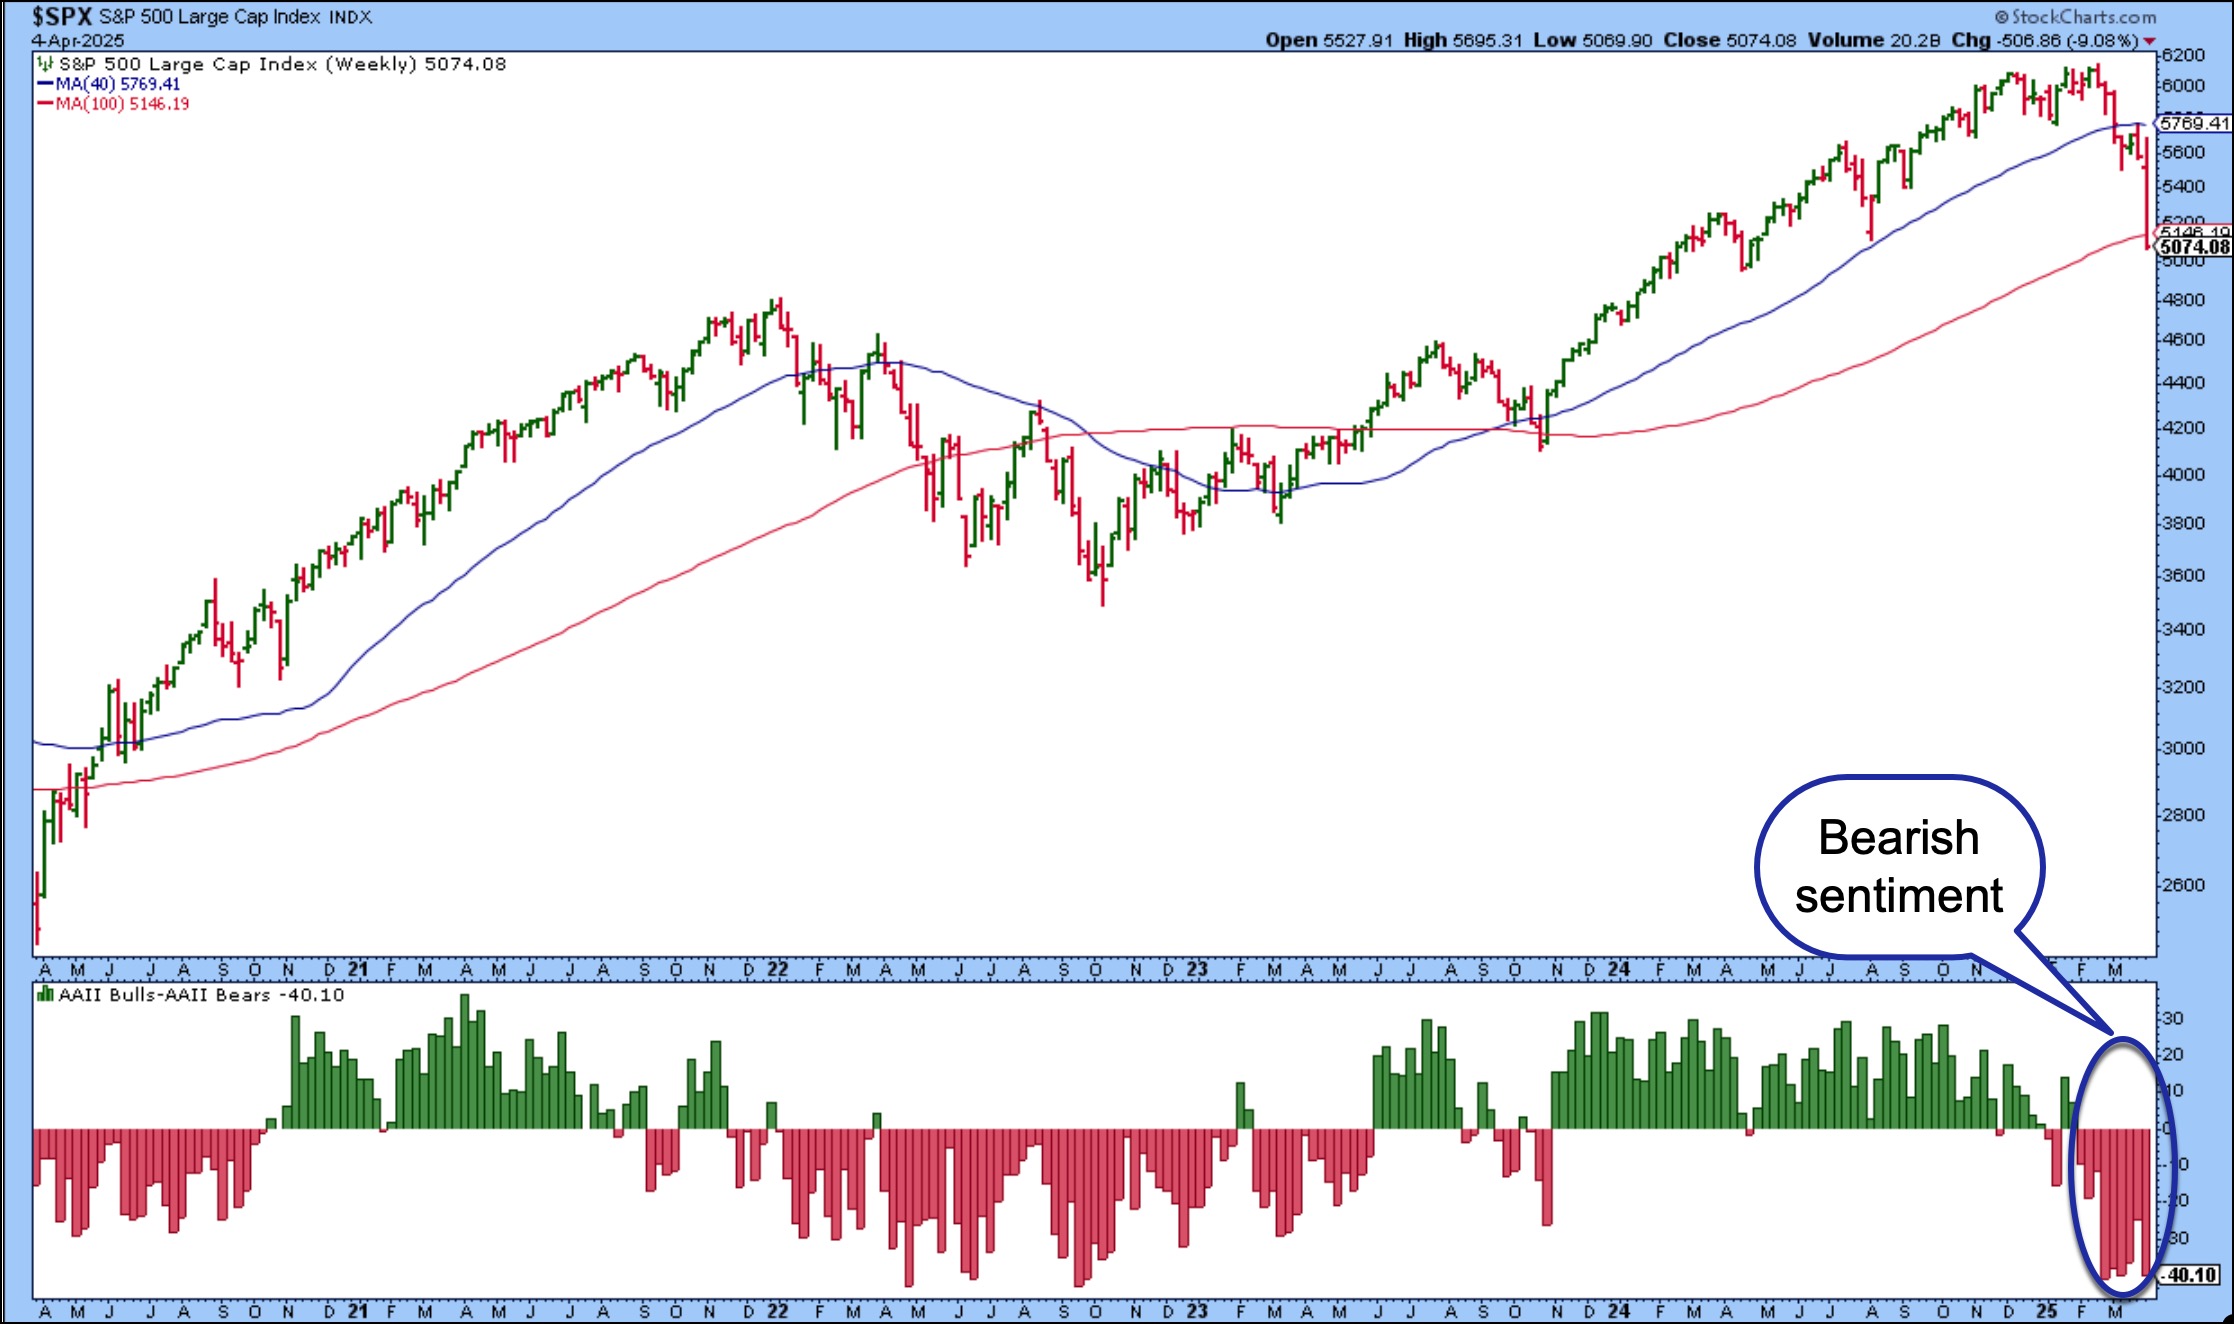
FIGURE 3. S&P 500 AND BULLISH VS. BEARISH SENTIMENT. Bearish sentiment is relatively high and the S&P 500 could fall if the bearish sentiment persists. Chart source: StockCharts.com. For educational purposes.
The lower panel shows that investor sentiment is negative, similar to between April 2022 and September 2022. Note how the market went through a correction before resuming its uptrend.
The price action in the S&P 500 coincides with extreme bearish sentiment and could remain this way for an extended period. How will you know if sentiment has reached extreme levels? It can be challenging but constant monitoring of market breadth and sentiment indicators can reveal a shift in behavior. When buyers come back in, the indexes break above resistance levels, and momentum indicators turn bullish, there’s a chance the bullish trend will resume.
The Bottom Line
Investors should stay on the sidelines until the unwinding of positions is in the rearview mirror. As painful as it may be to watch your portfolio lose value, at some point the selling will stop and buyers will get back in. Look for signs of this occurring before adding any positions to your portfolio. Congratulations to investors who followed the traditional 60% stocks, and 40% bonds portfolio mix. Rising bond prices provide some cushion to falling equity prices.
End-of-Week Wrap-Up
- S&P 500 down 9.08% on the week, at 5074.08, Dow Jones Industrial Average down 7.86% on the week at 38314.86; Nasdaq Composite down 10.02% on the week at 15,587.79.
- $VIX up 109.28% on the week, closing at 45.31.
- Best performing sector for the week: Consumer Staples
- Worst performing sector for the week: Energy
- Top 5 Large Cap SCTR stocks: Corcept Therapeutics, Inc. (CORT); Elbit Systems, Ltd. (ESLT); MicroStrategy, Inc. (MSTR); Palantir Technologies, Inc. (PLTR); XPeng, Inc. (XPEV)
On the Radar Next Week
- Earnings season kicks off with Delta Air Lines, Inc. (DAL), J.P. Morgan Chase (JPM), Wells Fargo (WFC), and others reporting
- March CPI
- March PPI
- FOMC minutes
- Several Fed speeches

Disclaimer: This blog is for educational purposes only and should not be construed as financial advice. The ideas and strategies should never be used without first assessing your own personal and financial situation, or without consulting a financial professional.


